Customer Lifetime Value (LTV): How to Calculate It and Decide How Much to Spend on Acquisition
11 min read · AstraLoop Studio
Most companies decide their acquisition budget backwards. They look at how much a customer costs (the CAC) and then try to push it as low as possible, as if the cost were the problem. But acquisition cost, on its own, tells you nothing. A customer worth 40 euros can be either very expensive or a steal - it depends on how much that customer is worth over time. And to know that, you need to calculate customer lifetime value (LTV, or CLV).
Lifetime value flips the perspective. Instead of starting from cost, you start from value. It tells you how much margin a customer generates over the entire course of their relationship with you, and therefore how much you can afford to spend to acquire them while staying profitable. Companies with a high LTV can pay more per click, outbid competitors in ad auctions, and grow faster. Those who don't know their LTV are flying blind.
In this guide we'll look at how to actually calculate it. Not the motivational-slide formula that uses revenue, but the margin-based one that holds up in a real P&L. Then we'll use that number for what matters: deciding how much to spend on acquisition through the LTV/CAC ratio, and understanding how AI now makes it possible to predict LTV before a customer even matures.

What customer lifetime value is (and isn't)
Customer lifetime value is the total margin an average customer generates for your company, from their first purchase until they stop buying. Full stop. The three key words are margin, average, and until they stop, and each one hides a common mistake.
Margin, not revenue. Mistake number one is calculating LTV on revenue. If a customer buys 500 euros of product from you but your gross margin is 40%, that customer isn't "worth" 500 euros to you - they're worth 200. Spending 300 euros to acquire them looks like a good deal if you're looking at revenue. In reality, you're losing 100 euros per customer. Serious LTV is always calculated on contribution margin, meaning revenue minus variable costs (product, shipping, payment fees, average returns).
Average, on a statistical basis. LTV isn't the value of the one loyal customer who has been buying from you for ten years. It's an average across a cohort - a group of customers acquired in the same period. A single sample doesn't make a budget decision.
Until they stop, meaning retention. This is the most overlooked piece. LTV depends dramatically on how long a customer sticks around. Improving your churn rate often has more impact on LTV than raising your average order value. That's why working on retention isn't a "soft" topic - it's a direct lever on the economic value of every customer, and therefore on how much you can invest to acquire new ones.
The margin-based LTV formula, explained properly
There are dozens of LTV formulas, from the crude to the highly refined. For an SMB or e-commerce business that wants to make concrete decisions, this is the right one, because it uses margin and doesn't require a data scientist:
LTV = Average Order Value × Gross Margin % × Annual Purchase Frequency × Average Relationship Length (years)
Let's break it down with precise terms:
- Average Order Value (AOV): the average value of an order. Total revenue divided by number of orders.
- Gross margin %: the percentage left over after variable costs. This is what turns revenue into real value.
- Annual purchase frequency: how many times, on average, a customer buys in a year. Annual number of orders divided by number of active customers.
- Average relationship length: how many years a customer keeps buying. Estimated as 1 divided by the annual churn rate. A 25% annual churn means an average length of 1 / 0.25 = 4 years.
Let's work through a concrete example, a supplements e-commerce business:
- Average order value: 60 euros
- Gross margin: 55%
- Frequency: 3 purchases a year
- Annual churn: 40%, so average length = 1 / 0.40 = 2.5 years
LTV = 60 × 0.55 × 3 × 2.5 = 247.50 euros of margin per customer.
This number, 247 euros, is the theoretical ceiling of what that customer is worth to you. Not how much you can spend to acquire them (we'll get to that in a moment), but the value to start from. Notice how much weight the relationship length carries: if you managed to bring churn down from 40% to 30%, the length would rise to 3.33 years and LTV to around 330 euros. Thirty percent more value without touching price or frequency - just by retaining customers better.
If you sell on a subscription basis (SaaS, monthly boxes, recurring services) the formula simplifies to: LTV = Monthly ARPU × Margin % ÷ Monthly Churn. With average monthly revenue of 30 euros, 80% margin and 5% monthly churn, LTV is 30 × 0.80 / 0.05 = 480 euros. Monthly churn is the variable the whole model hinges on.
The LTV/CAC ratio: the number that decides your budget
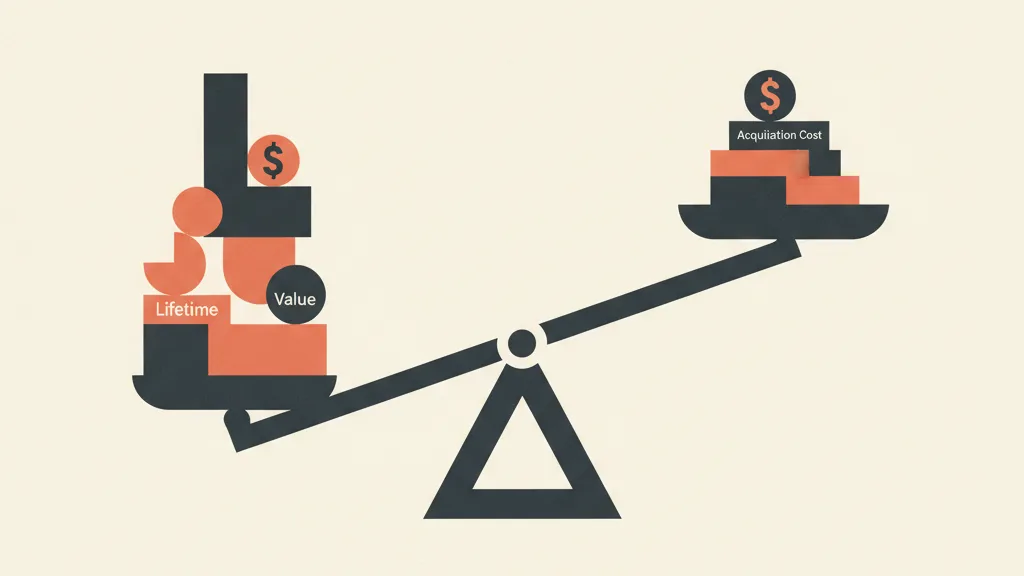
LTV alone doesn't tell you how much to spend. You need to compare it against acquisition cost, the CAC. The ratio between the two is the compass for acquisition unit economics.
LTV/CAC = customer value ÷ cost to acquire them
The benchmark, by now a standard in the SaaS and performance marketing world, is 3:1. Every euro spent on acquisition should generate roughly three in margin over time. Here's how to read the scale:
| LTV/CAC Ratio | What it means | What to do |
|---|---|---|
| Below 1:1 | You lose money on every customer | Stop - the model doesn't hold up: revisit margins, pricing, or channels |
| 1:1 to 3:1 | You profit, but with thin margins | Improve retention and margin before scaling |
| Around 3:1 | Healthy balance between growth and profit | Scale with confidence, keep optimizing |
| Above 5:1 | Great, but you're probably under-investing | You can afford to spend more and grow faster |
This last row surprises a lot of people. A 6:1 or 8:1 ratio looks excellent, and in a sense it is, but it often signals you're leaving growth on the table. If every customer returns six times what they cost you, you could raise your ad bids, go after more expensive audiences, and take market share while timid competitors stand still. In acquisition, a too-high LTV/CAC isn't always a win - sometimes it's excessive caution.
From the ratio you derive the practical figure: Maximum sustainable CAC = LTV ÷ 3. With the 247-euro LTV from the example, you can spend up to about 82 euros to acquire a customer while staying at a healthy 3:1. This is the number you give the marketing team as a ceiling for setting the advertising budget and campaign bids. Not an arbitrary limit set by gut feeling, but one derived from the real economics of the customer.
Watch the payback period
The 3:1 ratio ignores one crucial variable: when you recover the CAC. If LTV matures over three years but you pay the CAC today, for two years you're funding growth out of your own pocket. The payback period - the months needed to recover the acquisition cost from margin - should ideally stay under 12 months for an SMB without deep cash reserves. A 4:1 LTV/CAC with an 18-month payback can strain your cash flow more than a 3:1 that pays back in 6 months. Always look at both numbers together.
The mistakes that inflate LTV (and make you overspend)
LTV is an easy metric to manipulate, often unintentionally. Here are the three most common ways companies fool themselves:
- Using revenue instead of margin. Already mentioned, but it's common enough to repeat. It inflates LTV by a factor equal to the inverse of the margin and leads you to spend on acquisition amounts your P&L can't actually support.
- Assuming an infinite or overly long relationship. "Our customers stay forever" isn't a data point, it's a wish. If you have less than two or three years of history, you can't know the real relationship length: estimate it conservatively from observed churn and update it as you go.
- Averaging across all customers together. A customer from organic search and one from an aggressive discount campaign have wildly different LTVs. A single blended average hides the fact that you're acquiring discount hunters with rock-bottom LTV and immediate churn. Value-based segmentation (RFM analysis) shows you who your good customers really are.
This last point is the bridge to predictive LTV. Because the real question isn't "how much does a customer average," but "how much will this specific customer be worth," and ideally knowing it as early as possible.
Want to know what one of your customers is really worth, and how much you can afford to spend to acquire them? Ask us for an analysis of your LTV and CAC numbers: we'll show you where you're under-investing and where you're burning budget.
From historical LTV to predictive LTV: where AI comes in
LTV calculated with the formula is retrospective: it tells you how much past customers were worth on average. That's useful for understanding overall economics, but it has two serious limits. First, it's an average that flattens differences. Second, it arrives late: to know how much a cohort is really worth, you have to wait years. Meanwhile campaigns keep running, budget keeps getting spent, channels keep changing.
Predictive LTV flips the approach. Instead of waiting, a model estimates how much a customer will be worth based on the signals they give off in the first days or weeks: products purchased, acquisition channel, on-site behavior, email opens, first order value, speed of the second purchase. It's the same principle as AI-powered lead scoring, applied to economic value instead of closing probability.
What actually changes for acquisition:
- Budget allocated by expected value, not volume. If the model predicts that customers from campaign A will have double the LTV of campaign B, you shift budget to A even when the initial CAC is higher. You optimize for value at the end of the journey, not the immediate cost of the click.
- Differentiated ad bids by segment. You can afford a high CAC on segments with high predicted LTV and keep bids low on segments that historically churn quickly. This is where you stop spending blindly.
- Value signals fed back to the platforms. Instead of optimizing Meta or Google on purchase events (which treat every customer the same), you feed back the predicted value or real margin via your CRM. The algorithms learn to look not for whoever buys, but for whoever buys and stays. This is the shift from optimizing for ROAS to reasoning about overall spend efficiency, which we cover in more depth in MER vs ROAS.
For all of this to work you need a data infrastructure that connects acquisition and post-sale behavior: advertising sources on one side, real purchase history on the other. This is the work we do integrating a custom-built CRM with acquisition channels, so that real LTV data flows back to the campaigns and makes them progressively smarter. AI doesn't "guess" value out of thin air - it learns from your historical data, and it's only as accurate as your systems are organized.
Putting LTV to work, in practice
Knowing how to calculate LTV is useless if it stays in a spreadsheet. Here's how to turn it into an operational lever, from simplest to most advanced:
- Calculate baseline margin-based LTV with the formula above, using real data from the last 12-24 months. Even a rough estimate beats nothing.
- Derive the maximum sustainable CAC (LTV ÷ 3) and communicate it to marketing as an operational ceiling. From here on, every spending decision has a reference point.
- Segment by channel and cohort. Calculate LTV separately for each acquisition source. You'll almost always discover that some channels bring in customers worth three times as much as others. Shift budget accordingly.
- Attack retention. Since relationship length carries as much weight as everything else, every point of churn you recover raises LTV and widens your room to maneuver on acquisition. It's often the intervention with the best return.
- Close the loop with data. Feed real customer value back to the advertising platforms and, once volume justifies it, introduce a predictive model to allocate budget based on expected value instead of raw volume.
These steps fit into a bigger picture. LTV is one of the fundamental numbers in acquisition unit economics, alongside CAC and cost per lead. And acquisition itself isn't an isolated channel, but a system connecting lead generation, sales, and data: without that connection, LTV stays a theoretical number and campaigns keep optimizing for the wrong goal. If you're building or reviewing your customer acquisition strategy, LTV is the starting point everything else derives from.
In summary
Customer lifetime value is the metric that gives you economic permission to invest in growth. Calculate it on margin, not revenue. Use the LTV/CAC ratio as your compass, aim for a healthy 3:1, and remember that too high a ratio signals under-investment, not just health. Always check the payback period too, because cash flow doesn't wait for a three-year LTV. And when the data allows it, move from historical LTV to predictive LTV: that's how you stop deciding your budget by gut feeling and start pushing the accelerator exactly where expected value is highest.
Frequently asked questions
How do you calculate customer lifetime value in a simple way?
The practical margin-based formula is: Average Order Value × Gross Margin % × Annual Purchase Frequency × Average Relationship Length in years. Relationship length is estimated as 1 divided by the annual churn rate. The important thing is to use margin, not revenue, otherwise the value ends up inflated and you risk overspending on acquisition.
Why should LTV be calculated on margin instead of revenue?
Because revenue includes variable costs (product, shipping, fees) that aren't profit. A customer who buys 500 euros of product at a 40% margin is really worth 200 euros to you. Using revenue makes you believe you can spend more to acquire them than your P&L can actually support.
What's a good LTV/CAC ratio?
The standard benchmark is 3:1, meaning every euro spent on acquisition generates roughly three in margin over time. Below 1:1 you're losing money. Between 1:1 and 3:1 margins are thin. Above 5:1 you're probably under-investing and could grow faster by spending more.
How much can I spend to acquire a customer?
The maximum sustainable CAC is roughly LTV divided by 3. If a customer has a margin-based LTV of 240 euros, you can spend up to about 80 euros to acquire them while staying at a healthy 3:1 ratio. But also check the payback period: ideally the CAC should be recovered within 12 months so it doesn't put pressure on your cash flow.
What is predictive LTV and what is it for?
It's an estimate of a customer's future value based on signals from the first days or weeks (products purchased, channel, behavior, speed of the second purchase). Unlike historical LTV, which is a retrospective average, predictive LTV lets you allocate acquisition budget based on expected value instead of raw conversion volume, pushing harder on the segments worth the most.
Does retention affect customer lifetime value?
Enormously. Average relationship length is one of the factors in the formula, so reducing churn directly increases LTV. Retaining customers better often has more impact on value than raising average order value: going from 40% to 30% churn can grow LTV by more than 30% without touching price or purchase frequency.
If you want to move from LTV on a spreadsheet to a system that predicts customer value and automatically optimizes your acquisition budget, let's talk: we build the integration between data, CRM, and campaigns tailored to your business.