Meta Ads Reporting: What to Measure and How to Read Ads Manager
9 min read · AstraLoop Studio
The report you need isn't the one Ads Manager shows by default
Open Ads Manager and the first things you see are impressions, reach, clicks and CTR. Those numbers are real, but they answer a question you don't actually care about: how many people interacted with the ads. The question that keeps you up at night is a different one. Is this money coming back multiplied, or am I burning it?
A well-built Meta Ads report exists for one reason only: to tell you whether ad spend is generating customers and revenue, not just activity. The difference between an owner who scales and one who kills campaigns after the first month usually comes down to this. The first looks at cost per acquired customer and return. The second looks at CTR, convinces themselves "the ad is working," while the bank balance says otherwise.
In this guide we'll build a report together that starts from platform numbers and traces them all the way to the real conversions recorded in your CRM. Because the real value isn't reading Ads Manager - it's connecting it to what happens after the click.
The three categories of metrics (and why they matter in reverse order)
Not all metrics carry the same weight. You can split them into three levels, and the most common mistake is exactly this: giving weight to the first ones and ignoring the last.
1. Delivery metrics (diagnostic, not a result)
Impressions, reach, frequency, CPM. They tell you whether Meta is distributing your ads and at what cost you're reaching the audience. They help you understand why something isn't working, not whether a campaign is good. A frequency above 3 or 4 in a week on a small audience, for example, often explains a dropping CTR: people have already seen the ad too many times.
2. Engagement metrics (signals, not sales)
CTR, link clicks, cost per click, video hook rate, watch time. They tell you whether the creative and the message are working. They're useful for optimization, but a high CTR with zero conversions means only one thing: you're attracting the wrong people, or sending them to a landing page that doesn't convert. If you want to dig deeper into how to read it, we wrote a dedicated guide on what CTR on Facebook Ads is and how to read it.
3. Business metrics (these decide if you're profitable)
Cost per lead, cost per acquisition, ROAS and, above all, the real return calculated from your CRM. These are the only ones that tell you if you're actually making money. The problem is that Ads Manager only shows part of the picture, and often in a misleading way, as we'll see shortly.
| Level | Metrics | What it's for |
|---|---|---|
| Delivery | CPM, frequency, reach | Technical diagnosis |
| Engagement | CTR, CPC, hook rate | Optimizing creative and targeting |
| Business | CPL, CPA, ROAS, CRM-based return | Deciding if you're profitable |
The practical rule is simple: read the report from the bottom up. Start with the real return. If it doesn't add up, drop down into engagement and delivery metrics to find where the chain breaks. Anyone who reads top-down falls in love with clicks and ignores revenue.
The metrics to put in your report (and reference thresholds)
Here's the essential set. The thresholds are indicative and vary a lot depending on industry, product price and campaign type, but they give you a starting point to judge whether a number is "normal" or worth investigating.
- CPM (cost per thousand impressions): how much you pay to reach a thousand people. In Italy it typically ranges between 3 and 15 euros depending on the audience and seasonality. It rises in November and December, when competition ramps up for Black Friday and Christmas.
- CTR (link clicks, not "all"): always use the CTR on link clicks, not the one that also counts likes and comments. Below 0.8-1% on cold traffic is usually a sign of weak creative or a weak offer.
- CPC (cost per link click): depends on CPM and CTR. It tells you whether the cost of driving traffic is sustainable relative to your margin.
- Cost per lead (CPL): how much you pay for each contact. It only makes sense compared against the real value of that lead, never in absolute terms. A 40-euro CPL can be excellent or terrible depending on what a customer is worth to you. If yours is too high, read how to lower your cost per lead on Facebook Ads.
- Cost per acquisition (CPA): the number that actually matters. How much you pay for a paying customer, not a contact. It needs to stay below the margin that customer leaves you.
- ROAS (return on ad spend): revenue generated divided by spend. A ROAS of 4 means 4 euros of revenue for every euro spent. But be careful: it's revenue, not profit, and it's often inflated by Meta's attribution.
There's a very common mistake: stopping at CPL and declaring victory. CPL is an intermediate metric. A 15-euro lead that never buys costs more than a 60-euro lead that becomes a customer. The bridge between the two numbers is the lead-to-customer conversion rate, which lives in your CRM, not in Ads Manager. To understand how all these return metrics fit together, we have a deep dive on CAC, CPL and LTV in customer acquisition.
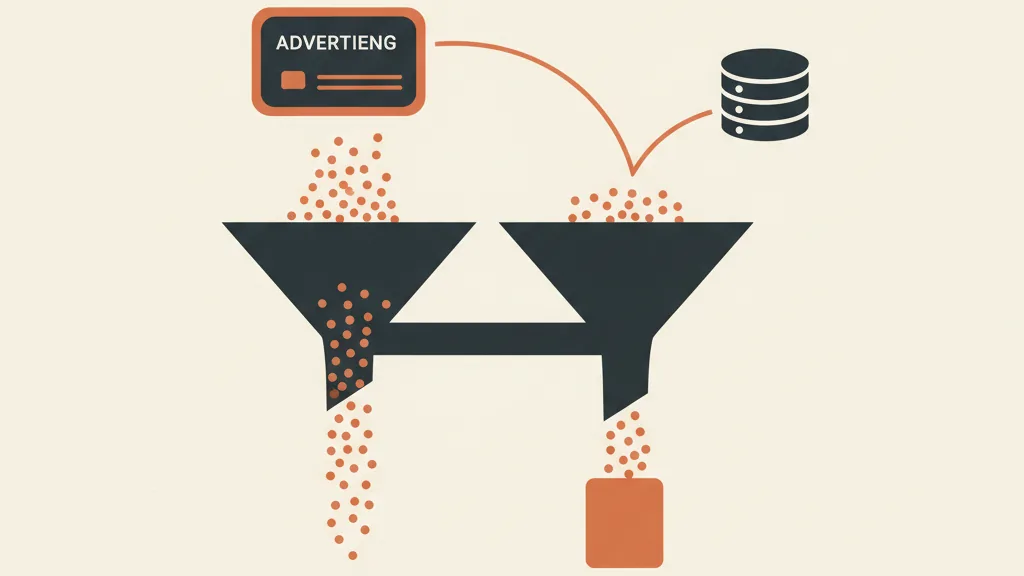
The attribution black hole: why Meta's numbers don't match reality
If you've ever compared the conversions Ads Manager claims against what you actually see in your CRM or e-commerce, you already know the numbers don't match. Meta usually reports more. It's not a bug: it's how attribution works.
The attribution model matters more than you think
By default Meta attributes a conversion to anyone who clicked within 7 days or viewed the ad within 1 day (the famous "7-day click, 1-day view"). In plain terms: Meta takes credit even for sales it barely contributed to. If someone sees your ad, then searches for the brand on Google and buys, Meta still counts it as its own conversion. That's why the sum of ROAS across all platforms often exceeds 100% of actual revenue: each one claims the same orders.
In your report always state explicitly which attribution window you're using, and never compare periods with different windows. If you want to understand the logic in depth, start with marketing attribution models and their limits and alternatives.
Post-privacy tracking: iOS, consent and lost data
After Apple's privacy changes and with increasingly strict cookie consent, part of the conversions no longer reach the browser pixel. Meta estimates them using statistical models (conversion modeling), which adds another layer of approximation. The technical countermeasure is Meta's Conversions API, which sends conversion events from your server instead of the browser and recovers data that would otherwise be lost. A report running on browser-only tracking today is reading a partial reality.
The practical consequence for your report is this: Ads Manager's numbers are a directional indicator, not accounting truth. They tell you which campaign is doing better than the others, but the real revenue is only found by cross-checking with actual sales data.
Connecting Ads Manager to the CRM: this is where the report becomes truly useful
The real leap forward is exactly this: stop evaluating campaigns only on platform numbers and start closing the loop with what happens in the CRM. Because a lead in Ads Manager is a filled-out form, while a customer in the CRM is cash collected.
The flow you need to build
- Every lead enters the CRM with its source. Campaign, ad set and ad need to arrive as data, via UTM parameters on the link or a direct pass-through from Meta lead forms. Without this, you'll never know which creative brought real customers.
- The CRM tracks the lead's status: contacted, qualified, appointment booked, offer sent, won or lost. This way you calculate the real conversion rate for each campaign, not just cost per lead.
- Offline conversions go back to Meta. When a lead becomes a customer in the CRM, that event can be sent back to Meta as an offline conversion. This way the algorithm learns to optimize toward leads that actually buy, not toward whoever fills out the form and disappears.
This third point is the one almost nobody does, and it changes everything. If you optimize campaigns on raw leads, Meta brings you more raw leads. If you optimize on real customers, Meta learns to find you people similar to those who already bought. At that point, the report no longer measures "how many forms," but "how many customers, and at what cost."
Want a report that connects your Meta spend to real customers in your CRM, not just clicks? Request a review of your tracking setup and we'll show you where the return is getting lost.
A concrete example of a complete read
Imagine two campaigns. Looking only at Ads Manager:
| Campaign A | Campaign B | |
|---|---|---|
| Spend | €1,000 | €1,000 |
| Leads | 50 | 25 |
| Cost per lead | €20 | €40 |
Looking only at CPL, Campaign A wins hands down. Now let's cross-check with the CRM:
| Campaign A | Campaign B | |
|---|---|---|
| Leads that become customers | 2 (4%) | 8 (32%) |
| Real cost per customer | €500 | €125 |
Complete reversal. Campaign B, the one that looked "expensive," brings in customers at a quarter of the cost. Without the CRM connection you'd have killed the right one and scaled the wrong one. This is exactly why CRM conversion signals are worth more than platform numbers.
How to structure the report: dashboard and cadence
A useful report reads in two minutes and answers one question only: "scale, hold, or cut?". Here's the structure we recommend.
The three blocks of the report
- Summary block (the top view): total spend, customers acquired, cost per customer, real return. Four numbers. If you only have ten seconds, look at these.
- Per-campaign block: the same business metrics broken down by campaign and ad set, so you see where the money is paying off and where it isn't.
- Diagnostic block: CTR, CPM, frequency, hook rate. Open this only when a business block is red and you need to understand why.
How often to look at it
Not every day. Meta campaigns need data to exit the learning phase, and reacting to a single day's numbers is the fastest way to ruin optimization. A healthy cadence looks like this:
- Quick weekly check on business numbers per campaign. If something is clearly out of range, you dig in.
- Full monthly report connected to the CRM, where you assess real cost per customer and decide on budget and scaling.
- Quarterly analysis to read the trend, seasonality and the lifetime value of customers acquired from each channel.
If you want to automate the dashboard side, many teams build the visualization with Looker Studio connected to marketing data, so the report updates itself instead of being rebuilt by hand every time. And if you need quick checks before even opening the report, this list of quick checks for your Meta account will save you time.
The mistakes that make a report useless
- Measuring spend instead of return. "We spent €3,000 and generated 40,000 impressions" isn't a result, it's a cost.
- Comparing periods with different attribution windows. The numbers become incomparable and decisions become random.
- Trusting Meta's ROAS as if it were profit. It's attributed revenue, often inflated, and it doesn't account for margins, returns or costs.
- Not tracking the source all the way to the sale. Without the bridge to the CRM, the report stays half-built and makes you reward the wrong campaigns.
- Looking at too many metrics. A report with forty columns doesn't get read. Better to have six numbers that drive decisions than forty that paralyze you.
The common thread running through all these mistakes is always the same: confusing activity with results. A mature Meta Ads report always keeps its eye on the money, uses platform numbers to diagnose, and closes the loop in the CRM. That's how you stop asking "is the ad working?" and start knowing "this campaign brings me customers at X euros each, and I can afford to scale it."
Frequently asked questions
What's the most important metric in a Meta Ads report?
Cost per acquired customer calculated from the CRM, not cost per lead. A cheap lead that never buys costs more than an expensive lead that becomes a customer. The final metric is always how much you pay for a paying customer relative to the margin they leave you.
Why don't Ads Manager's conversions match what I see in my CRM?
For two reasons. Meta's attribution (7-day click, 1-day view by default) takes credit even for sales it barely contributed to. And after iOS privacy changes, part of the conversions are statistically estimated. Meta's numbers are directional; the real revenue is in the CRM.
How often should I check my Meta Ads campaigns?
A quick weekly check on business numbers and a full monthly report connected to the CRM for budget decisions. Avoid reacting to a single day's data: campaigns need time to exit the learning phase.
What's a good ROAS on Meta Ads?
It depends on your margins - there's no universal number. A ROAS of 4 (€4 of revenue per €1 spent) is often cited as a benchmark, but it's attributed revenue, not profit. You need to compare it against your real margin and remember that Meta tends to inflate it through attribution.
How do I connect Meta Ads to my CRM?
Get the source (campaign, ad set, ad) into the CRM via UTM parameters or Meta lead forms, track each lead's status through to the sale, and send offline conversions back to Meta when a lead becomes a customer. This way the algorithm optimizes toward people who actually buy.
Should I use 'all' CTR or link-click CTR?
Always use link-click CTR. 'All' CTR also counts likes, comments and shares, inflating the number without telling you whether people actually reach the landing page. To evaluate creative and offer, you only need the clicks that drive traffic toward conversion.
If you're evaluating your campaigns on Ads Manager alone, you're probably rewarding the wrong ones. Talk to us: we build the bridge between Meta and your CRM to measure real customers.